3.3 Flood Calculus
Abstract
I will show that the time of appearance of the different species belonging to the genus Homo, the age of the Earth, the solar system and the universe can be calculated from the patriarchs’ ages by using simple recurring mathematics that can be understood by anyone with a high school background. So don’t let yourself intimidate by some mathematical formulas you will encounter: only the four basic operations are used and some simple algebra. Readers nevertheless not familiar with such calculations should not worry. You can also just trust the results and focus on the conclusions.
Contents
Chronology of Homo Species
The Age of the Solar System
The Global Flood
Cosmological Dates
References
Site Navigation
3.3.1 Chronology of Homo Species
The method used for this calculation is based on what has been discussed in section 3.1.5: since we can obtain a late and early date for Adam by adding either the patriarchs’ ages when they fathered their sons, which yields the traditional birth date of the late Adam, or their whole ages, which yields the birth date of the early Adam, it is straightforward to ask whether there are other methods to obtain other dates of other Adams. Take for instance the Fibonacci numbers, the first two of them are given as ![]() and
and ![]() . Then the third number is defined as
. Then the third number is defined as ![]() and in general
and in general ![]() , which is called a recursion. What if the two dates of the early and late Adam are also just the initial numbers of a series of other dates calculated recursively?
, which is called a recursion. What if the two dates of the early and late Adam are also just the initial numbers of a series of other dates calculated recursively?
This could be done in an infinite number of ways. However, the possibilities are considerably reduced if we impose some straightforward conditions. But let us first establish the initial numbers. We will define the late Adam as the first Adam and the early Adam as the second Adam. So first and second involves retreating in time. Accordingly, we refer to the late flood as the first flood and the early flood as the second flood. According to table 5, we define the following initial numbers:
| = time from first flood to Abraham born in 2167 BC | |
| = sum of ages at birth from Noah to Terah minus age of Noah at flood (600 years; Gen 7:6) | |
| = 501.51+100+35+30+34+30+32+30+29+129+10x9/12-600 | |
| = 358.26 years |
| = time from first Adam to first flood | |
| = sum of ages at birth from Adam to Lamech plus 600 | |
| = 130+105+90+70+65+162+65+187+182+9´9/12+600 | |
| = 1662.75 years |
| = time from second flood to first Adam | |
| = sum of ages from Noah to Terah minus 600 | |
| = 950+600+438+433+464+239+239+230+148+205−600 | |
| = 3346 years |
| = time from second Adam to second flood | |
| = sum of ages from Adam to Lamech plus 600 | |
| = 930+912+905+910+895+962+365+969+777+600 | |
| = 8225 years |
Accordingly, we define the following numbers:
| = time from third flood to second Adam | |
| = time from third Adam to third flood | |
| = time from fourth flood to third Adam | |
| = time from fourth Adam to fourth flood |
Now, a straightforward conditions is to require that the ratios of the four new numbers remain the same as for the initial numbers. In other words, we postulate that ![]() yields the same numbers as
yields the same numbers as ![]() when normalized, which means that the first number of each series must equal 1. This must be done by dividing the first series of ratios with
when normalized, which means that the first number of each series must equal 1. This must be done by dividing the first series of ratios with ![]() and the second with
and the second with ![]() . Thereby we get
. Thereby we get
![]()
and
![]()
from which we conclude that
![]()
and
![]()
as well as
![]()
since we assume that the ratios shall yield the same numbers. Transforming these equations, we finally get
![]()
This can also be expressed more conveniently by
![]()
![]()
![]()
![]()
From which we see that we get the new numbers by simply multiplying the initial numbers with the scaling factor ![]() . This calls to mind that lengths on a geographic map are scaled in the same manner in order to get real lengths. As a result, the patriarchs’ ages can be considered a time map, which yields real times being much greater than the times provided by the map, even though the unscaled values represent real times as well. This is why the new values can in turn be regarded as “map lengths” for other real values. So here we have defined a recursion.
. This calls to mind that lengths on a geographic map are scaled in the same manner in order to get real lengths. As a result, the patriarchs’ ages can be considered a time map, which yields real times being much greater than the times provided by the map, even though the unscaled values represent real times as well. This is why the new values can in turn be regarded as “map lengths” for other real values. So here we have defined a recursion.
However, the scaling factor x is still unknown because ![]() is unknown. Defining
is unknown. Defining ![]() could also be done in an infinite number of ways. A first restricting condition is to require that
could also be done in an infinite number of ways. A first restricting condition is to require that ![]() depend on all initial numbers
depend on all initial numbers ![]() ,
, ![]() ,
, ![]() and
and ![]() because they are the only numbers directly provided by the Bible. Making
because they are the only numbers directly provided by the Bible. Making ![]() depend on less or more than these four values would mean to not consider all or go beyond the information the Bible is providing. Now, such a dependency can go from maximum simplicity to ever greater complexity. The last case is undetermined as there is no limit in making things complicated. The first case, however, is determined because there is a limit in making things simple. In fact, the simplest arithmetic operation of all four basic operations (addition, subtraction, multiplication and division) is without doubt addition. This is why we simply define
depend on less or more than these four values would mean to not consider all or go beyond the information the Bible is providing. Now, such a dependency can go from maximum simplicity to ever greater complexity. The last case is undetermined as there is no limit in making things complicated. The first case, however, is determined because there is a limit in making things simple. In fact, the simplest arithmetic operation of all four basic operations (addition, subtraction, multiplication and division) is without doubt addition. This is why we simply define ![]() as the sum of all the initial numbers:
as the sum of all the initial numbers:
![]() 13’592.3 years
13’592.3 years
Consequently
![]() 37.93882
37.93882
and
![]() 63’083 years
63’083 years
![]() 126’943 years
126’943 years
![]() 312’047 years
312’047 years
rounded to integers. Be aware that the intermediate results of these calculations have a precision of 16 digits. Thereby, if you make your own calculations with more rounded intermediate numbers, they will diverge from these dates. The best is to use a spreadsheet calculator or download my calculation. These times are intervals. In order to obtain the dates of the corresponding events, we need to make further calculations. The date of ![]() in BC, that is, the beginning of the time interval from the late flood to Abraham in years ago, is
in BC, that is, the beginning of the time interval from the late flood to Abraham in years ago, is ![]() plus Abraham’s date of birth in 2167 BC:
plus Abraham’s date of birth in 2167 BC:
![]() 2525.26 BC
2525.26 BC
The other dates are obtained by retreating from the previous dates:
![]() 4188 BC
4188 BC
![]() 7534 BC
7534 BC
![]() 15’759 BC
15’759 BC
These dates have already been calculated and discussed in section 3.1.5. Since ![]() is the sum of the initial numbers, the dates of
is the sum of the initial numbers, the dates of ![]() and
and ![]() are the same:
are the same:
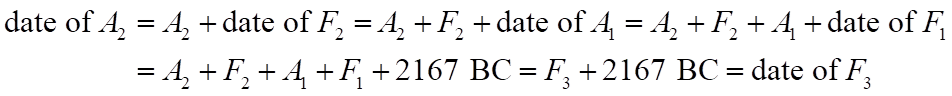
This suggests that a flood date (symbolized by the letter F) may also be considered a date pointing to a step in human evolution attributed to some Adam (symbolized by the letter A). In other words, Adam is always associated with some flood, confirming that he prefigures Noah, as discussed in section 3.1.3. This yields
![]() 17’759 ya
17’759 ya
![]() 80’842 ya
80’842 ya
![]() 207’785 ya
207’785 ya
![]() 519’832 ya
519’832 ya
in years ago (adding 2000 years to the dates in BC). The 80’842 ya of the third Adam fits well with the feminization of the morphology of modern humans, an enhancement in language and the slow onset of behavioral modernity (sec. 3.2.6). The first successful migration out of Africa may also be linked to this date. If true, this would link a genetic enhancement with a flood event triggered by a climatic wet period, which made the living conditions in eastern Africa difficult (sec. 3.2.7). The 207’785 ya date is undoubtedly pointing to the emergence of an archaic form of Homo sapiens (sec. 3.2.6) and the 519’832 ya date to the Neanderthals, their predecessors (sec. 3.2.5).
As mentioned above, the same recursion can again be applied by taking the newly acquired times as given and calculating other dates by just increasing each index by 2 and using the same rules as before. This yields
![]() 515’665 years
515’665 years
It is easy to show that ![]() remains the same for every recursion. Therefore
remains the same for every recursion. Therefore
![]() 2’393’286 years
2’393’286 years
![]() 4’816’079 years
4’816’079 years
![]() 11’838’688 years
11’838’688 years
This yields the following dates:
![]() 519’832 ya
519’832 ya
![]() 2’913’118 ya
2’913’118 ya
![]() 7’729’197 ya
7’729’197 ya
![]() 19’567’885 ya
19’567’885 ya
The date of 2.9 Ma refers to a time when human evolution branched off from australopiths, in other words, to the emergence of H. habilis (sec. 3.2.3). The 7.7 Ma date could refer to the divergence time between the genera Homo and Pan, which is characterized by the rise of bipedalism. As discussed in section 3.2.2, many animals walk on two legs, but human bipedalism is special and emerged already with australopiths.
In 1978, footprints of australopiths were discovered on the site of Laetoli in Tanzania by Mary Leakey. They were at this time the oldest known evidence of bipedalism, dating back to about 3.7 Ma (White 1980; Feibel et al. 1996). Bipedalism can also be inferred from fossilized skeletons, among which famous “Lucy” attributed to Australopithecus afarensis (Henke & Tattersall 2015 p. 2373). In 2001/2, some fossils of Sahelanthropus were found in the Djurab Desert of Chad (Brunet et al. 2002). They date back to about 7 Ma. Unfortunately, no bones below the skull were found. However, the hole where the spinal cord enters the skull (foramen magnum) is placed directly underneath the skull instead of more in the back as in non-bipedal apes, which is typical for an erect standing posture (Klein 2009 pp. 184-186). Sahelanthropus is regarded as a possible common ancestor between humans and chimpanzees (Henke & Tattersall 2015 p. 603). If the age of 7 Ma of this fossil is correct, it is likely that the split arrived some time earlier.
What about the 19.6 Ma date? It may point to the divergence time between the Hominidae family of great apes, which contains tailless orangutans, gorillas, chimpanzees and humans, and the also tailless but smaller or lesser apes called Hylobatidae or more commonly gibbons, which is another family making part of the superfamily Hominoidea. Taillessness is regarded as a first characteristic of hominization (Henke & Tattersall 2015 p. 1370). There are only a few fossils near the time of split between these both families because apes live in hot and humid rainforests where bones and other biological materials disintegrate fast. In 2002 was discovered the up to then oldest fossil of a great ape named Pierolapithecus catalaunicus dated to about 13 Ma (Moyà-Solà et al. 2004).
However, genetic studies show that this split must have occurred earlier: timetree.org is a public resource for evolutionary history of life. Their web site includes a calculator that finds divergence times between different species or higher biological taxa like entire families taking into account several studies. The calculator yields an average date of about 19.5 Ma for the divergence time between Hominidae and Hylobatidae. This is, of course, an estimate, as the dates given by 57 studies made between 1985 and 2022 range from 11.5 Ma to almost 37 Ma.
These dates could be used to calculate further recursions. But the older fossils are, the more difficult becomes their unearthing and dating. This is why it does not make sense to retreat further into the past with this method related to divergence times of species because the uncertainty is too large. Furthermore, no australopith fossils were found outside Africa, which is why they probably did not get out of Africa. The same is true for African apes. Therefore, the 7.7 Ma and 20 Ma dates are not linked to flood scenarios, contrarily to the subsequent dates, which thus are linked by analogy. Therefore, this recurring calculation must end here because it is based on the analogous unfolding of several floods.
3.3.2 The Age of the Solar System
This does not prevent us from calculating other dates still further in the past: if one reads the flood account literally, there was only one flood. In order to take this into account, one can consider all the period from 2.9 Ma to the present a flood time. In fact, 2.9 Ma comes close to the beginning of the Quaternary, which is dated to about 2.6 Ma, marking the extinction of the star-shaped marine algae Discoaster pentaradiatus and Discoaster surculus. The Quaternary includes the Pleistocene and the Holocene, in which we live actually. However, the motivation for defining the Quaternary is mainly as a period of important climate fluctuations (Gradstein et al. 2004 pp. 28, 441).
This change did not pop up suddenly, as can be seen from figure 15, which shows Earth’s climatic history over the past 5 million years based on oxygen isotopic ratios retrieved from benthic foraminifera shells in deep-sea sediment cores. They can be used to determine indirectly the temperature of the surrounding water at the time when they were formed (Faure 1986 pp. 441-447, Lisiecki & Reymo 2005). This is why the dating of the Quaternary with regard to climatic change is somewhat arbitrary.

Figure 15: The last five million years ago as a period of glacial and interglacial oscillations revealed through d18O=18O/16O ratios of fossil benthic foraminifera. Peaks represent glacials or marine isotope stages (MIS) numbered evenly, while lows represent interglacials numbered oddly. Actually, we live during interglacial MIS 1 (redrawn from Lisiecki & Reymo 2005).
The different floods as rainy interglacials in contrast to the dry glacials, extending over the whole Quaternary and beyond, have played an important role in the emergence of human species, as discussed in section 3.2.7. They have also caused several coastal floods all over the planet because of the sea-level rise during the interglacials. But none of them was global in the sense that the whole planet was covered with water. This is why they must be considered floods that kind of echoed the only global flood that happened at a much earlier date, as we shall see further on.
| Genesis | Day of the year | Day | Description |
| 7:1-4 | 7 days before the flood = day 40 of the year (see next line) | 0 | Noah begins to fill the ark with the animals. |
| 7:11-12 | 17th day of 2nd month = 30 + 17 = day 47 of the year | 7 | The flood begins with 40 days of rain. |
| 7:17-24 | 40 days later: 27th day of 3rd month = 2 × 30 + 27 = day 87 | 47 | The rain stops but the sea level continues to rise during 110 more days. |
| 8:1-4 | 17th day of 7th month = 6 × 30 + 17 = day 197 | 157 | Rise stops and a wind starts to dry the earth; the ark comes to rest on the Ararat. |
| 8:5 | 1st day of 10th month = 9 × 30 + 1 = day 271 | 231 | The waters decrease; other tops of mountains are disclosed. |
| 8:6-7 | 40 days later: 11th day of 11th month = 10 × 30 + 11 = day 311 | 271 | A raven is sent out, flying to and fro. |
| 8:8-9 | 7 days later: 18th day of 11th month = 10 × 30 + 18 = day 318 | 278 | A dove is sent out coming back. |
| 8:10-11 | 7 days later: 25th day of 11th month = 10 × 30 + 25 = day 325 | 285 | A dove is sent out coming back with an olive branch. |
| 8:12 | 7 days later: 2nd day of 12th month = 11 × 30 + 2 = day 332 | 292 | A dove is sent out without returning. |
| 8:13 | 1st day of new year = 360 + 1 = day 361 | 321 | The cover of the ark is removed. |
| 8:14 | 27th day of 2nd month of next year = 360 + 30 + 27 = day 417 | 377 | The earth is dry. |
Table 6: Chronology of the flood as described by Genesis 7-8.
In the following, I will refer to the time from the emergence of H. habilis 2.9 Ma to the present as the flood era because it can be associated with the flood chronology provided in chapters 7 and 8 of Genesis, as resumed in table 6. This chronology is also a time map referring to much larger times. It spans 377 days from Noah’s entering the ark to the drying of Earth’s land surface, taking into account that the months have 30 days because 150 days are counted from the 17th day of the 2nd month to the 17th day of the 7th month (Gen 7:11; 8:3-4). In order to calculate the scaling factor x of the map, we proceed analogously to the previous calculations: we make correspond the 377 days of the literal duration of the flood to the 2.9 Ma of the flood era, which yields:
![]()
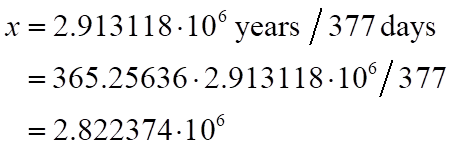
where we took 365.25636 days for a sidereal year. What can be done with this scaling factor? It can be applied to the literal time interval ![]() from Adam’s birth to the flood. The creation of the universe happened six days before Adam’s birth. So adding six days to
from Adam’s birth to the flood. The creation of the universe happened six days before Adam’s birth. So adding six days to ![]() and multiplying this time with x should lead us to the beginning of the universe. But these six days can be neglected, so
and multiplying this time with x should lead us to the beginning of the universe. But these six days can be neglected, so ![]() goes just as well. If we multiply
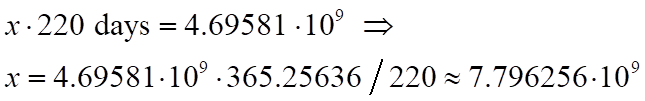
goes just as well. If we multiply![]() with x, we obtain a time interval of about 4.693 billion years from the real origin of our universe to, not the present, but the beginning of the flood era because the different flood intervals must be appended to each other, as has been done for all floods up to now. Thereby, if we want a date in years ago, we must add the 2.9 million years of the flood era to this number, which yields about 4.696 Ga.
with x, we obtain a time interval of about 4.693 billion years from the real origin of our universe to, not the present, but the beginning of the flood era because the different flood intervals must be appended to each other, as has been done for all floods up to now. Thereby, if we want a date in years ago, we must add the 2.9 million years of the flood era to this number, which yields about 4.696 Ga.
This is not a date that points to the origin of the whole universe caused by the big bang, which happened about 13.8 Ga. But it perfectly corresponds to the formation of the solar system, which is our restricted universe. The date of the big bang as well as the formation of the Milky Way will be obtained with further recursions, as we will see. To mention also that there has been no Adam around when the solar system was formed. As we have seen several times, however, a valid solution among others is partial, which means that not every detail has to be rendered by a partial solution. Thereby, Genesis 2 does not require that life in whatever form must have been around when the solar system started to form.
Based on meteorites that formed after the pre-solar nebula sufficiently cooled down to allow materials to exist in the solid state, the age of the solar system is dated to 4.5682 Ga (sec. 1.3.1). This date is a lower limit because one cannot be sure that the meteorite providing this date was the very first condensed material, since the temperature was not everywhere the same in the solar disk, which thereby did not condense everywhere at the same time. Nevertheless, dating based on helioseismology yields a similar date of ![]() Ga, which points to the start of nuclear fusion inside the Sun (Bonanno et al. 2002), while a theoretical model yields
Ga, which points to the start of nuclear fusion inside the Sun (Bonanno et al. 2002), while a theoretical model yields ![]() Ga for this start (Houdek & Gough 2011). However, the date when the pre-solar nebula started to form by contraction from a fragmenting giant molecular cloud, which is in an equilibrium that must be broken (sec. 1.3.1), is an even more accurate starting point. This triggering may have happened by a nearby supernova, the passage of the cloud through one of the galaxy’s spiral arms, two clouds interacting, or a similar event (Rothery et al. 2011 p. 291). Thereby, 4.696 Ga is a possible date for the birth of the solar system.
Ga for this start (Houdek & Gough 2011). However, the date when the pre-solar nebula started to form by contraction from a fragmenting giant molecular cloud, which is in an equilibrium that must be broken (sec. 1.3.1), is an even more accurate starting point. This triggering may have happened by a nearby supernova, the passage of the cloud through one of the galaxy’s spiral arms, two clouds interacting, or a similar event (Rothery et al. 2011 p. 291). Thereby, 4.696 Ga is a possible date for the birth of the solar system.
If hydrogen is taken as an analog for gathering waters (sec. 1.2.1), the contraction of the solar nebula can also be regarded as a flood. This way, even more dates can be calculated. We just have to correspond the 377 flood days with the age of the solar system, infer from this a scale factor x and multiply different days with that scale factor. For that purpose, it is necessary to find a general formula. So let d be an arbitrary day, then![]() is the length from the first day to the dth day. Its date is obtained by deducing
is the length from the first day to the dth day. Its date is obtained by deducing ![]() from
from ![]() expressed in days by multiplication with a sidereal year s and transforming the result back into years by dividing by s. This yields a formula without s:
expressed in days by multiplication with a sidereal year s and transforming the result back into years by dividing by s. This yields a formula without s:
![]()
![]()
If we equal d to zero, we get S and are at 4.696 Ga as expected. On the other hand, if we put 377 days for d into this formula, we get zero years ago, which means that we are in the present. One could argue that this calculation should be independent of the time when it is performed. In principle, the present should be at the end of the 377 days, that is, in 2525 BC. This would imply that S should be equal to 4.696 Ga minus 4525 years. I made the calculation with this S: it doesn’t change the result significantly. So for the sake of simplicity, we consider that the dates of the literal flood and our present are the same. We pick out the days 7, 47, 157, 231 and 285 as special days according to table 6, getting the following dates:
| Description in Genesis 7:1-8:11 | flood day d | date in Ma |
| Noah enters the ark | 0 | 4696 |
| rain begins and lasts 40 days | 7 | 4609 |
| rain stops, but ocean rise continues | 47 | 4110 |
| rise ends and wind blows; ark on Ararat | 157 | 2740 |
| tops of mountains seen | 231 | 1819 |
| dove back with olive branch | 285 | 1146 |
Table 7: Each of these dates in million years ago is calculated according to the same formula.
Let us discuss the meanings of these dates: the starting date of 4696 Ma corresponds to the initiation of the collapsing of the solar nebula, leading to the spiral disk with in its center the Sun. As we have seen (sec. 1.2.2), this spiral disk can be compared with whirlwinds, which start to gather the humidity in an ever denser cloud until it begins to rain in the center. In a similar way, the solar cloud gathered mainly hydrogen until the temperature and pressure in the center triggered nuclear fusion. So within this context, the rain means fusion of hydrogen atoms as an analogous process to water vapor condensation, when fine water droplets fusion together to form a drop. This is why the beginning of the rain seven days after Noah entered the ark, corresponding to 4609 Ma (tab. 7), points to the start of the Sun’s nuclear activity transforming hydrogen into helium. As we have seen above, this fits very well with the dates obtained by different methods.
The solar system formation happened in parallel to the formation of the Earth, which passed through a similar spiral structure during its initial stage. The rain within this context has another meaning: the Hebrew word for rain in Genesis 7:12 is geshem, which in Aramaic also means body (Dan 3:28; 4:33; 7:11). It is not entirely clear where this double usage comes from, but in any case geshem is used in lieu of matar (Hillel 2006 p. 36), as in the context of the flood (Gen 7:4), the destruction of Sodom and Gomorrah, where it refers to the downfall of brimstone and fire (Gen 19:24), and the plague of hail during the Exodus (Ex 9:18). This shows that in Hebrew rain can also refer to the precipitation of solid bodies, just as this happened during the Earth’s accretion, when fine dust and hydrated particles coagulated together to form bigger parts, which fell down on Earth’s surface (sec. 1.2.2).
According to Sleep et al. (1989), there is no direct record of the earliest impacts hitting the Earth. By contrast, the lunar record is well preserved and well studied, from which the situation on Earth can be extrapolated. The impact energy of the infalling bodies before about 4 Ga was strong enough to not only evaporate the whole ocean but even mineral matter. The minimal energy to evaporate the ocean and produce a steam atmosphere was about ![]() (fig. 16) corresponding to a body diameter of 440 km. Such an impact would also have destroyed any life in the form of microorganisms, if there were any before 4 Ga. The time it took for steam to cool again and rain on the ground as liquid water was on the order of 2000 years, which is rather short. The impacts decreased rapidly such that from about 4 Ga no significant vaporizing impacts occurred anymore. In other words, the rain forming the primordial ocean ceased. There is a large uncertainty, though: the last ocean-vaporizing impact may have occurred between 4.44 Gyr and 3.8 Gyr, corresponding to an average of 4.12 Ga. This is nevertheless in good agreement with Genesis 7:17-24, which states that the rain ceased on the 47th day corresponding to 4110 Ma (tab. 7).
(fig. 16) corresponding to a body diameter of 440 km. Such an impact would also have destroyed any life in the form of microorganisms, if there were any before 4 Ga. The time it took for steam to cool again and rain on the ground as liquid water was on the order of 2000 years, which is rather short. The impacts decreased rapidly such that from about 4 Ga no significant vaporizing impacts occurred anymore. In other words, the rain forming the primordial ocean ceased. There is a large uncertainty, though: the last ocean-vaporizing impact may have occurred between 4.44 Gyr and 3.8 Gyr, corresponding to an average of 4.12 Ga. This is nevertheless in good agreement with Genesis 7:17-24, which states that the rain ceased on the 47th day corresponding to 4110 Ma (tab. 7).
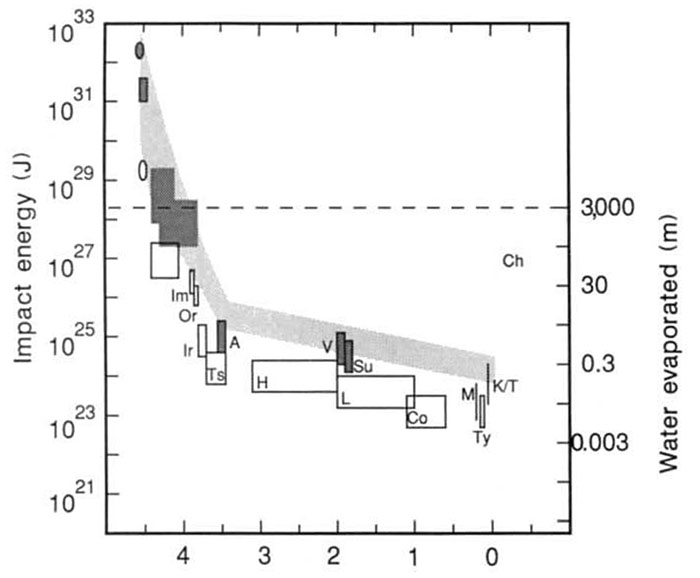
Figure 16: The largest impacts on Earth and Moon. Open boxes are lunar, filled boxes terrestrial. The decreasing curve indicates the impact energy of the infalling bodies. The dashed horizontal line indicates a threshold below which the impacts no longer had enough energy to vaporize the whole ocean. This corresponds to about 4 Ga (Sleep et al. 1989).
So during this final stages of Earth’s accretion, the molten hydrated silicates were heated and separated into minerals as well as water vapor, which partly rose to the surface (sec. 1.3.2). This continued later when a crust formed and the remaining water was pushed from the deep into the troposphere, from where it finally rained down. In other words, before this diluvial precipitation, the water was squeezed out from the ground. Genesis 7:11 describes indeed that “all the fountains of the great deep were broken up, and the windows of the heavens were opened up”. There is also agreement with the timing, as the oldest rocks found on Earth testifying to the first crust date from about 4 Ga (sec. 1.4.2). This is why the biblical 47th day corresponding to 4110 Ma also indicates the onset of continent formation.
The Earth probably had small landmasses already before 4 Ga because evidence from zircons shows that continental crust was present since 4.4 Ga and surficial weathering by liquid water occurred at least since 4.2 Ga (Wilde et al. 2001; Mojzsis et al. 2001). But this crust has probably been destroyed by the late bombardment. In any case, this means that rain fell on land masses, eroded them and carried the material into the ocean, where they settled as sediments and over time were transformed into sandstones, mudstones, etc. The oldest sedimentary rocks are found in Akilia Island in southwestern Greenland and date to about 3850 Ma (Nutman et al. 1997). So there has clearly been land above the sea level at least since this time.
3.3.3 The Global Flood
Despite the fact that it stops raining on the 47th day, the ocean continues to rise during 110 days until the 157th day, corresponding to 2740 Ma, when the highest mountains on Earth were covered (tabs. 6 and 7). This doesn’t make much sense if interpreted literally, in other words, naively. Of course, the soil can absorb much water during rain and release it after through rivulets, streams and rivers, which finally converge to the ocean. This may overflow lakes but does not elevate the sea level as the same water that rains out at some place on Earth has been evaporated mostly over the ocean. Thereby, it is impossible that the highest mountains are covered with water by meteorological events, even though the mountains were much less elevated in the Archean than at present.
On the other hand, such a global flood can happen over long epochs of several hundreds of million years due to submarine continental crust formation, which diminishes the world’s ocean basin capacity such that the water is displaced over the continent producing a marine transgression. This is like someone who gets into a bathtub filled with water, causing the water level to rise. As a consequence, the sea level rises when there is an increase in crust formation under water. If it is important and fast enough, a little and flat continent can entirely be flooded, especially in the Archean when crust formation was more common than today and landscapes were flat. Continental crust formation does not necessarily involve an increase in emerged land mass but in the first place refers to rocks with relatively low density independently if it is above or under sea level. In fact, the mean heights of several regions of the Earth are below sea level if the entire continental plate is taken into account (fig. 17).
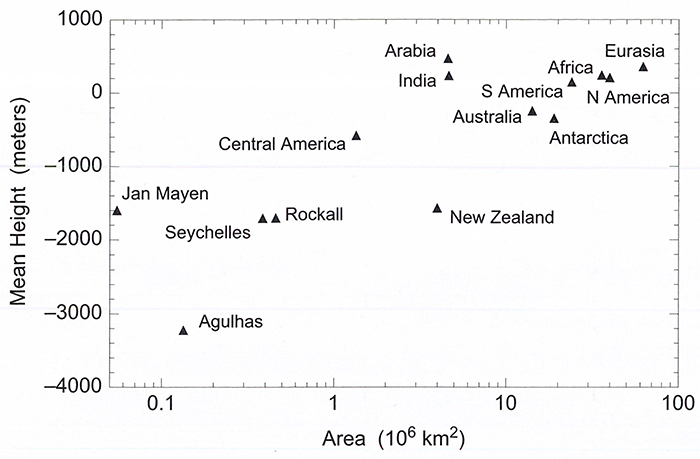
Figure17: Mean continental heights as a function of continental area, showing that for some regions the main part of continental crust lies below sea level (redrawn from Condie 2010 p. 26).
The geological record of the Archean is not very accurate because only a slim fraction of the cratons from this time survived up to the present (Allègre 2001 p. 193). The scarcity of zircons older than 3 Ga also implies that any early felsic crust was of local rather than global extent. In addition, the primitive crust was oceanic, which is continually formed at mid-ocean ridges and then spreads apart towards continental boundaries where it is subducted into the mantle. This is why it does not survive longer than 200 million years (Rogers & Santosh 2004 p. 11). On the other hand, continental crust has been formed since about 4 Ga, but it has simultaneously also been destroyed through subduction, erosion and other processes. Despite these constraints, there are a number of techniques that allow reconstructing the history of formation of the continents.
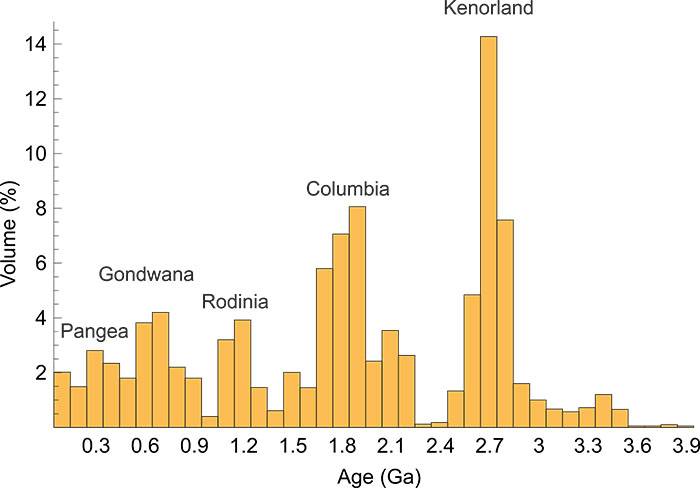
Figure 18: The formation of continental crust since about 4 Ga, leading to supercontinents (Condie & Aster 2010).
The net amount of crust formation that was preserved up to the present can be extracted from uranium/lead isotopes found in zircons at different places around the globe in conjunction with other data. As can be seen in figure 18, the rate of crust formation that was preserved happened episodically, corresponding to the peaks. It is thought that these peaks are related to the formation of the supercontinents Pangea (0.3 Ga), Gondwana (0.6 Ga), Rodinia (1.1 Ga), Columbia (1.8 Ga) and Kenorland (2.7 Ga), when about 14% of continental crust was produced within roughly 100 million years (Condie & Aster 2010).
A supercontinent is an assembly of continents and cratons. It is thought that they assemble and break apart periodically. The reason for this is that, due to its large surface, a supercontinent shields heat radiation from the mantle, which is subsequently heated up such that its convection currents increase. Thereby, the lithosphere becomes unstable and the supercontinent breaks up into several pieces that drift away from each other. These broken continental parts eventually meet on the other side of the globe and form a new supercontinent, from where the cycle starts again (Condie 2011 p. 332).
At first thought, the formation of a supercontinent rather seems to cause the contrary of a flood, that is, an increase in land masses. However, it is assumed that most of the formation of the first crust took place under water. Continental crust formation is associated, for instance, with large igneous provinces (LIPs) and continental flood basalts (CFBs). LIPs are very large accumulations greater than 100’000 km2 of all types of igneous rocks erupted or emplaced at depth within a few million years with effusion rates greater than those of mid-ocean ridge basalts. The causes of such formations are volcanism and mantle plumes at subduction zones or at hot spots, which are not directly linked to plate tectonics. CFBs are produced by giant volcanic eruptions coating large stretches of land or the ocean floor with basalt lava. Only about 20 percent of Archean LIPs and CFBs were above the ocean, compared to roughly 80 percent in the post-Archean (fig. 19). This also suggests higher sea levels in the Archean (Kump & Barley 2007; Flament et al. 2008).
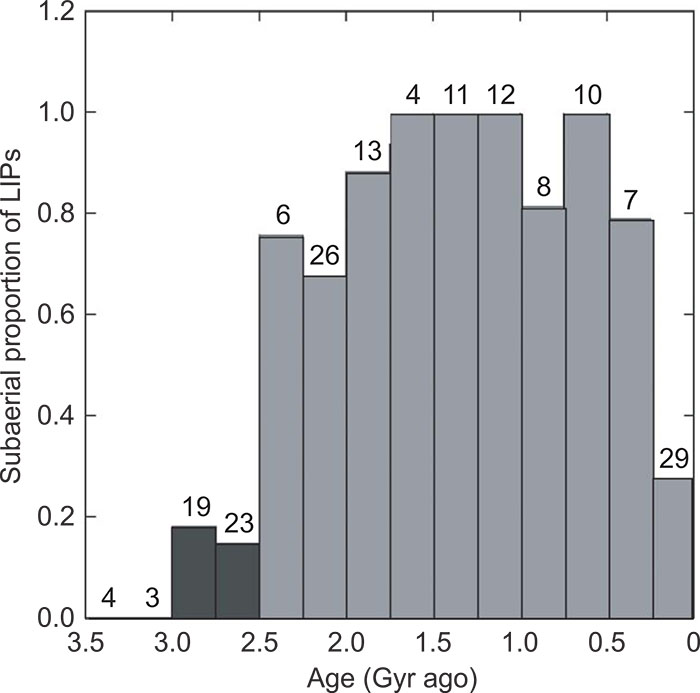
Figure 19: This diagram shows that in the Archean (dark bars), the percentage of LIPs above sea level was only about 20 percent (reproduced from Kump & Barley 2007).
Let us consider other data that point to 2.7 Ga: the ocean collects all types of matter that is weathered out of the continent and carried along rivers. These become mainly sediments, of course, but certain substances become also dissolved in water through chemical reactions with continental rocks. Among them is the alkaline earth metal strontium, which essentially contains the stable isotopes 87Sr and 86Sr released into solution in rivers, lakes and groundwater. During transport in the oceans or in a closed basin on the continent, it is mixed and homogenized isotopically, thus representing the composition of a large drainage basin. Strontium also enters the oceans through hydrothermal input at ocean ridges (Veizer & Mackenzie 2003).
In order to measure the input of strontium into the ocean, it is not its concentration that matters but the ratio 87Sr/86Sr, which is less subjected to variations in the different rocks containing strontium than its concentration. 87Sr is a stable decay product from rubidium. On the other hand, 86Sr is not produced by any decay process. So the ratio 87Sr/86Sr is increasing everywhere in the mantle, the ocean and the crust. In addition, the crust is enriched in strontium from the mantle through complicated formation processes. This is why the increase of 87Sr/86Sr in the mantle is less significant than in the crust (Faure 1986 p. 163).
In the ocean, strontium reenters the rock cycle primarily by chemical coprecipitation with calcium carbonate. In fact, calcium is another solute that is washed out from continents. It is part of a complex carbon cycle, involving the ocean, atmospheric CO2, volcanism, living organisms, etc. (Walker 1990; Brady 1991). It can be simplified as follows: CO2 in the atmosphere makes rain slightly acid, which destroys carbonate minerals like calcite, dolomite and ankerite. Therefore, calcium is washed out from continental polymineralic rocks like limestone, chalk, marble, and so on, which contain those minerals, and gets into the ocean, where it is deposited as calcite. Over long geologic times, calcite is then metamorphosed into the same carbonate rocks from which calcium has been washed out. These rocks come above sea level through tectonic processes and the cycle starts again.
Because strontium is precipitated together with calcium to form carbonate rocks, the different minerals inside these rocks had the same strontium ratio than sea water at the time of their formation. Consequently, these minerals have preserved a record of the changing isotopic composition of oceanic strontium, wherefore the composition of strontium in carbonates is a natural tracer to study water flows across different kinds of rocks. This is also why it is an indicator of continental freeboard, for if there is little freeboard, the input of strontium into the ocean decreases, which is why the formation and destruction of supercontinents can be tracked with the strontium isotopic record (Condie 2011 p. 338).
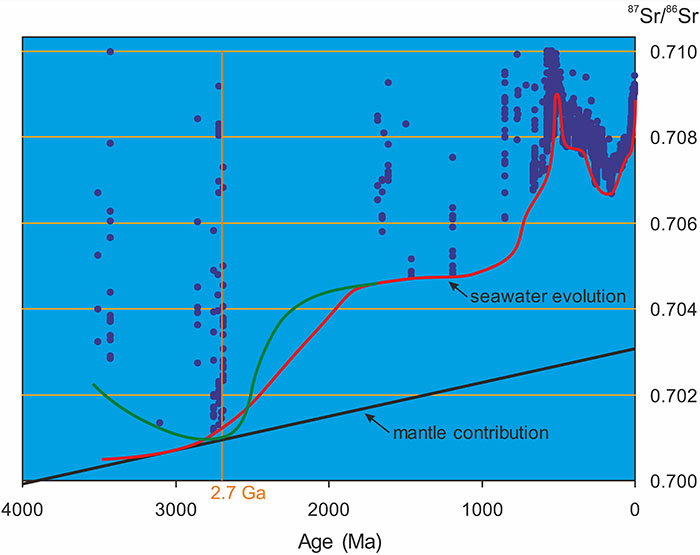
Figure20: Seawater evolution according to 87Sr/86Sr ratios. The green curve indicates that at 2.7 Ga the whole planet got shortly under water (modified from Shields & Veizer 2002).
So freeboard is echoed in the carbonate record, which goes back to the early Archean as shown in figure 20: each mineral sample is represented by a little circle. As can be seen, the mineral samples are more or less aligned vertically. The reason for this is that the samples of such a column stem from the same rock, which roughly formed at the same time. During this process, the minerals in the rock are metamorphosed through heat, pressure and so on, which more or less increases the isotopic ratios for each mineral depending on their chemical composition. This is why the lowest values are assumed to be the nearest to the original ratios.
There are fewer samples in the Precambrian (541 - 4600 Ma) than in the Phanerozoic (<541 Ma) because carbonate rocks have been better preserved in more recent times. The white circles represent less accurately dated values than the black circles. Thereby, the sea water evolution is less certain in the Precambrian. This is why the authors of this study were cautious and have drawn the curve for the Precambrian with lesser oscillations than for the Phanerozoic. If one is a bit bolder and draws the curve a bit nearer to the lowest values, one gets the green curve (my drawing), which has a minimum at around 2.7 Ga. This is where it touches the straight line of the mantle contribution of strontium to the ocean.
This joining of both curves around 2.7 Ga is regarded as the starting point of continental emergence (Faure 1986 p. 193; Veizer & Mackenzie 2003; Flament et al. 2008; Condie 2011 pp. 337-338). In fact, when land areas are extensive and elevations high, weathering and erosion fed the oceans with large amounts of continental strontium, which has higher 87Sr/86Sr ratios than the mantle. As a result, the sea water has higher ratios than the mantle as well. The carbonates that are forming in the ocean at the same time incorporate this ratio and keep it over very long geological times. In contrast, when the continental area is small, the main strontium input into the ocean comes from ocean ridges and/or mantle plumes. At such a stage, the 87Sr/86Sr ratio in both the ocean and in the mantle is nearly the same, which is why one can conclude that the continents were either flooded during a relatively short time and re-emerged around 2.7 Ga (green curve) or emerged after being under water for a long time (red curve). In any case, as there are sedimentary carbonates and other sediments prior to 2.7 Ga, there must have been continental freeboard at this time, otherwise no sediments were found at all.
Another possibility to detect emerged regions in the past consists in looking for eroded landmasses. Ruptures in the deposition of sedimentary layers, so-called unconformities, testify to such erosions. In fact, there is an angular unconformity in the Pilbara craton in Australia (fig. 21). Angular means that horizontally parallel strata of sedimentary rocks are deposited on an eroded region whose sediments are aligned at a certain angle to the overlying layers. This region in the Pilbara craton is covered with rocks that are only slightly metamorphosed, so they have preserved the eroded surface from further destruction. It is outcropping on a length of at least 75 km, which yields a lower limit of its original extent. It is thought that these angular sediments were part of an emerged continent at around 3.5 Ga when they were exposed to erosion, proving that emerged landmasses existed at this time (Buick et al. 1995).
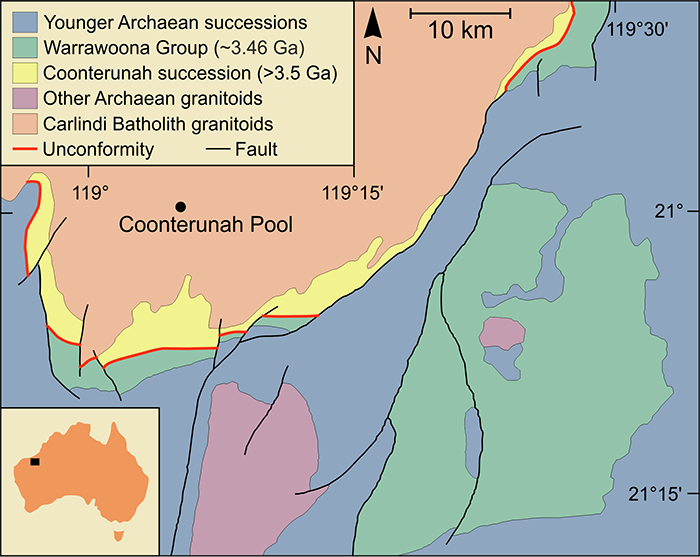
Figure21: The unconformity lines show ancient eroded landmasses from around 3.5 Ga (redrawn from Buick et al. 1995).
Between 2.78 and 2.75 Ga the Pilbara craton was rifted apart creating several basins where fluvial sediments were deposited (Hickman & Van Kranendonk 2012). Between 2.71 and 2.63 Ga a marine transgression continued this trend, letting behind the Jeerinah formation, a stratigraphic record ranging from coastal to offshore sediments almost covering the entire craton (Thorne & Trendall 2001 pp. 129-141). It is not present on the low-relief landmass, where the above-mentioned unconformities were discovered (fig. 22). So one could conclude that the transgression did not reach it. However, this must not necessarily be the case because if the sea level rises, the freeboard area diminishes and thereby also the sediment input rate. Furthermore, its highest area had a low relief. Consequently, in case the craton was entirely covered with water, the transgression must have been rapid, depositing on it only a very tiny (if any) sediment layer, which was rapidly eroded away when the ocean retreated again.
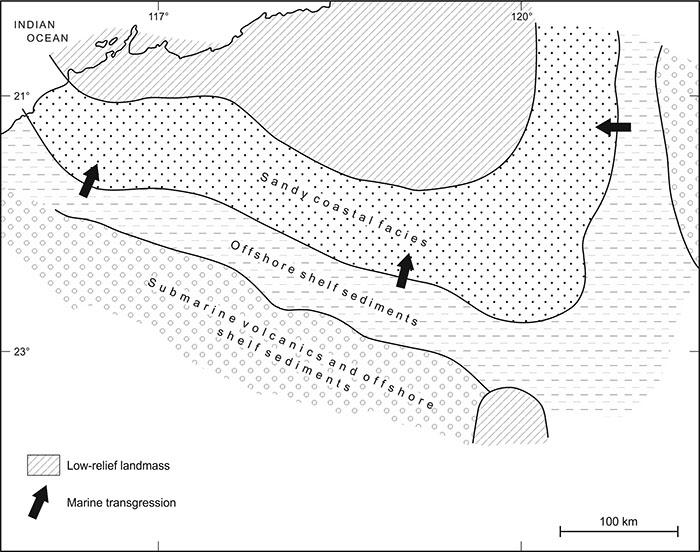
Figure22: Marine transgression of the Pilbara craton between 2.71 and 2.63 Ga (adapted from Thorne & Trendall 2001 p. 140).
According to Genesis 7:17-24, the rise of the ocean took place during 110 days, at the end of which the maximum was reached. This happened on the 157th day corresponding to 2.7 Ga. Afterwards, the waters retreated again. As a result, the ark came to rest on the Mount Ararat on the same day. This is why the time from the moment when all mountains were covered with water until their peaks reappeared again did not last longer than one day, which corresponds to multiplying one day with the scale factor x (sec. 3.3.2) and dividing by a sidereal year to obtain years. This yields roughly 12 million years. Compared to large geological time scales, this is rather short. Thereby, a direct detection of the flood in the sedimentary record is difficult. But as we have seen, there are indirect indicators.
The retreating of the waters is an allusion to the emergence of the continents that occurred after 2.7 Ga (fig. 19). In fact, the first supercontinent Kenorland formed around this time (fig. 18). On the other hand, the tops of mountains appearing out of the ocean on the 231th day (1.8 Ga) coincide with the first supercontinent Columbia, which finally led to the next supercontinent Rodinia on the 285th day (1.1 Ga), when the dove sent out from the ark finally found firm ground (tab. 7 and fig. 18).
This same dove comes back with an olive branch, which is likely to be an allusion to major steps in the emergence of life on land. Low carbon 13C/12C ratios are an indicator of life on land. In fact, there is no known mechanism for significant lowering of these ratios in the absence of land plants in recent settings (Horodyski & Knauth 1994). Such ratios attributed to photosynthetic microorganisms exist in paleokarsts of the Mescal Limestone in Arizona dated to about 1.1 Ga (Kenny & Krinsley 1998). Furthermore, the possibly oldest terrestrial microbial fossils, eukaryotic sphaeromorphs, have been found in the Stoer Group of the Torridonian (Scotland) dated to 1199 ± 70 Ma (Cloud & Germs 1971, Turnbull et al. 1996, Strother et al. 2011, Wellman & Strother 2015). The biblical 1146 Ma lies within this time interval.
3.3.4 Cosmological Dates
As we have seen in section 1.2.1, the “wind of God” (Gen 1:2) refers to different collapsing spiral objects including our galaxy, the early solar disk, the terrestrial vertex and whirlwinds on Earth’s surface. In Genesis 8:1-4, there is also mention of a wind of God: “God made a wind blow over the earth, and the waters subsided”, which happens on the 157th day, corresponding to around 2.7 Ga (tab. 7) when the sea level rose and the oceans shortly covered the entire Earth before the continents reappeared through geological processes, as discussed in the previous section. Thereby, no atmospheric wind was necessary for this process, which is why the wind has another meaning in this context.
In fact, the same Hebrew word ruach as in Genesis 1:2 is used for wind, which makes a link to the spiral objects because they are also involved in a drying process. As for the solar cloud, it was drying out space in the sense that mainly hydrogen, hydrated dusts and water were gathered in its center, leaving behind empty and thereby “dry” space outside the center. Later during the T Tauri phase, the infalling material produced a jet mainly perpendicular to the rotating disk, blowing away the dust, ices and gases above the disk. Still later when the Sun started its nuclear activity, the solar wind, composed of charged particles, swept away the inner disk from remaining dusts and gases, leaving behind greater pieces of rock and then the early inner planets in the phase of their accretion (sec. 1.3.1). In this sense, the early Earth was “dried up” mainly from hydrogen, hydrated particles and ice.
Therefore, since we know that the 4.696 Ga points to a starting event of the wind of God, that is, the collapsing of the solar nebula, we can consider it an event happening on the 157th day because the wind started on that day according to Genesis 8:1-4 (tab. 6). Hence, it is straightforward to calculate the real date that corresponds to the first of the 377 days. We proceed as usual: we consider the 377th day as the end of the literal flood around 2525 BC. Because astronomical time lengths are much greater, this date can as well be regarded as our present. Then, we assume that the 220 days from the 157th day to the 377th day are a length on a reduced time map with scaling factor x. Thereby, in order to get 4.696 Ga, we need to multiply the scaling factor x with 220 days, which yields
taking again 365.25636 days for a sidereal year. We then get the real time corresponding to the first of the 377 days by simply multiplying 377 days with x as follows:
real time![]()
Thus, the real event happened about 8 Ga, which should point to the formation of our galaxy, the Milky Way, because this is the next level referred to by Genesis 1 (fig. 3).
As summarized by Jones & Lambourne et al. (2004 ch. 1), the Milky Way was formed in different steps according to its structure, which is analogous to the solar system: instead of planets, asteroids and all the other objects surrounding the Sun, it contains about ![]() stars, and in the place of the Sun, there is the bulge in its center, where star concentration is highest with a massive black hole in the very center. The entire galaxy is surrounded by a spherical and dim halo composed of the oldest stars and mainly of invisible dark matter, which makes up the major part of the entire galactic mass. The bulge is surrounded by the spiral disk, where stars move around the center like planets around the Sun on nearly circular orbits, giving the galaxy a flying-saucer shape. The disk itself is subdivided into the thick and thin disk according to the proximity of the stars to the galactic plane. Our Sun is part of the thin disk, which contains younger stars compared to the thick disk.
stars, and in the place of the Sun, there is the bulge in its center, where star concentration is highest with a massive black hole in the very center. The entire galaxy is surrounded by a spherical and dim halo composed of the oldest stars and mainly of invisible dark matter, which makes up the major part of the entire galactic mass. The bulge is surrounded by the spiral disk, where stars move around the center like planets around the Sun on nearly circular orbits, giving the galaxy a flying-saucer shape. The disk itself is subdivided into the thick and thin disk according to the proximity of the stars to the galactic plane. Our Sun is part of the thin disk, which contains younger stars compared to the thick disk.
In addition to their position in the galaxy, there are several other criteria how the different parts of the Milky Way can be distinguished from each other: age, chemical composition, kinematics, angular momentum, and so on. From these data, it is possible to infer that all parts formed at different epochs. In particular, the formation of the thick and thin disk were independent, with the thick disk starting about 12 Ga and ending at about 8 Ga when the thin disk started to form (Fuhrmann 2011; Haywood et al. 2013; Bensby et al. 2014; Bergemann et al. 2014). So the age of about 8 Ga for the thin disk, where our solar system is located, seems to be accurate, even though the reasons for its formation still remain unclear. Several scenarios have been proposed (Feltzing & Chiba 2013; Robin et al. 2014) and research is still ongoing. In fact, up to now only stars in the vicinity of the Sun have been examined. For more accurate results, more stars must be analyzed, which is underway with the ESA Gaia satellite and the Planetary Transits and Oscillations (PLATO) mission to be launched in some years (Miglio et al. 2017).
It would be interesting to analyze whether the other flood days also point to major events, such as this has been done for the solar system (tab. 7). But this would go beyond the scope of this book. Rather, we again apply the same recurrence calculation to the Milky Way itself, considering that the start of its formation happened on the 157th day inside a still wider context. As we have seen several times, galaxy formation is similar to star formation: a molecular cloud collapses, producing a wind and finally a spiral disk. There is also strong radiation and a particle wind coming out of the galactic center. This is why the formation of our galaxy may be considered another 157th day event such that the same calculation can be applied than before. This time the scaling factor x is determined by
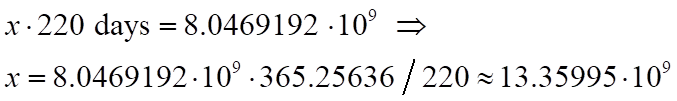
which should point to the very real origin of the whole universe since there is no further structure above galaxies in the cosmos (fig. 3 and tab. 2), in other words, to the big bang:
real time![]()
Data collected by the Planck spacecraft, the Wilkinson Microwave Anisotropy Probe and other probes allowed indeed to calculate an age of the universe of 13.787 ± 0.020 billion years (Planck-Collaboration 2020 p. 15, table 2, last column). This calculation is based on the standard Lambda Cold Dark Matter (LCDM) model, which uses a flat geometry, that is, the parameter for curvature Wk is taken to be exactly zero. However, there are many other models and hints that Wk could be negative (Di Valentino et al. 2021), in which case the sum of all energy densities, W, would be greater than one and the universe be closed (sec. 1.1.2). This would change its age, which is why such model-dependent results have to be taken with some reserve, even though the oldest objects in the observable universe come close to this age (Di Valentino et. al 2020). There are also model-independent calculations, showing that Wk is negative (Favale et al. 2023; Wu et al. 2023; Yang et al. 2023), while others consider that it is positive (Wei & Melia 2022). So the shape of the universe is still a matter of debate (sec. 1.1.2).
References
- Bensby, T., Feltzing, S., & Oey, M. S. (2014). Exploring the Milky Way stellar disk-A detailed elemental abundance study of 714 F and G dwarf stars in the solar neighbourhood. Astronomy & Astrophysics, 562, A71.
- Bergemann, M., Ruchti, G. R., Serenelli, A., Feltzing, S., Alves-Brito, A., Asplund, M., . . . G. Tautvaišienė. (2014). The Gaia-ESO Survey: radial metallicity gradients and age-metallicity relation of stars in the Milky Way disk. Astronomy & Astrophysics, 565, A89.
- Bonanno, A., Schlattl, H., & Paternò, L. (2002). The age of the Sun and the relativistic corrections in the EOS. Astronomy & Astrophysics, 390(3), 1115-1118.
- Brady, P. V. (1991). The effect of silicate weathering on global temperature and atmospheric CO2. Journal of Geophysical Research: Solid Earth, 96(B11), 18101-18106.
- Brunet, M., Guy, F., Pilbeam, D., Mackaye, H. T., Likius, A., Ahounta, D., . . . Zollikofer, C. (2002). A new hominid from the Upper Miocene of Chad, Central Africa. Nature, 418(6894), 145-151.
- Buick, R., Thornett, J. R., McNaughton, N. J., Smith, J. B., Barley, M. E., & Savage, M. (1995). Record of emergent continental crust ∼3.5 billion years ago in the Pilbara craton of Australia. Nature, 375(6532), 574-577.
- Cloud, P., & Germs, A. (1971). New pre-paleozoic nannofossils from the Stoer formation (Torridonian), Northwest Scotland. Geological Society of America Bulletin, 82(12), 3469-3474.
- Condie, K. C. (2011). Earth as an Evolving Planetary System (2nd ed.). Elsevier.
- Condie, K. C., & Aster, R. C. (2010). Episodic zircon age spectra of orogenic granitoids: the supercontinent connection and continental growth. Precambrian Research, 180(3-4), 227-236.
- Di Valentino, E., Melchiorri, A., & Silk, J. (2020). Planck evidence for a closed Universe and a possible crisis for cosmology. Nature Astronomy, 4(2), 196-203.
- Di Valentino, E., Mena, O., Pan, S., Visinelli, L., Yang, W., Melchiorri, A., . . . Silk, J. (2021). In the realm of the Hubble tension - a review of solutions. Classical and Quantum Gravity, 38(15), 153001.
- Faure, G. (1986). Principles of Isotope Geology (2nd ed.). John Wiley & Sons.
- Favale, A., Gómez-Valent, A., & Migliaccio, M. (2023). Cosmic chronometers to calibrate the ladders and measure the curvature of the Universe: A model-independent study. Monthly Notices of the Royal Astronomical Society, 523(3), 3406-3422.
- Feibel, C. S., Agnew, N., Latimer, B., Demas, M., Marshall, F., Waane, S. A., & Schmid, P. (1996). The Laetoli hominid footprints-a preliminary report on the conservation and scientific restudy. Evolutionary Anthropology, 4, 149-154.
- Feltzing, S., & Chiba, M. (2013). Elemental abundances in the Milky Way stellar disk(s), bulge, and halo. New Astronomy Reviews, 57(3-4), 80-99.
- Flament, N., Coltice, N., & Rey, P. F. (2008). A case for late-Archaean continental emergence from thermal evolution models and hypsometry. Earth and Planetary Science Letters, 275(3-4), 326-336.
- Fuhrmann, K. (2011). Nearby stars of the Galactic disc and halo – V. Monthly Notices of the Royal Astronomical Society, 414(4), 2893-2922.
- Gradstein, F. M., Ogg, J. G., & Smith, A. G. (Eds.). (2004). A Geologic Time Scale 2004. Cambridge University Press.
- Haywood, M., Di Matteo, P., Lehnert, M. D., Katz, D., & Gómez, A. (2013). The age structure of stellar populations in the solar vicinity-Clues of a two-phase formation history of the Milky Way disk. Astronomy & Astrophysics, 560, A109.
- Henke, W., & Tattersall, I. (Eds.). (2015). Handbook of Paleoanthropology (2nd ed.). Springer.
- Hickman, A. H., & Van Kranendonk, M. J. (2012). Early Earth evolution: evidence from the 3.5–1.8 Ga geological history of the Pilbara region of Western Australia. Episodes Journal of International Geoscience, 35(1), 283-297.
- Hillel, D. (2006). The Natural History of the Bible: An Environmental Exploration of the Hebrew Scriptures. New York: Columbia University Press.
- Horodyski, R. J., & Knauth, L. P. (1994). Life on land in the Precambrian. Science, 263(5146), 494-498.
- Houdek, G., & Gough, D. O. (2011). On the seismic age and heavy-element abundance of the Sun. Monthly Notices of the Royal Astronomical Society, 418(2), 1217-1230.
- Jones, M. H., & Lambourne, R. J. (Eds.). (2004). An Introduction to Galaxies and Cosmology. Cambridge University Press.
- Kenny, R., & Krinsley, D. H. (1998). Silicilied Micropeloid Structures from the 1.1 Ga Mescal Limestone, North-Central Arizona: Probable Evidence for Precambrian Terrestrial Life. The Mountain Geologist, 35(2), 45-53.
- Klein, R. G. (2009). The Human Career: Human Biological and Cultural Origins (3rd ed.). The University of Chicago Press.
- Kump, L. R., & Barley, M. E. (2007). Increased subaerial volcanism and the rise of atmospheric oxygen 2.5 billion years ago. Nature, 448(7157), 1033-1036.
- Lisiecki, L. E., & Raymo, M. E. (2005). A Pliocene‐Pleistocene stack of 57 globally distributed benthic δ18O records. Paleoceanography, 20, PA1003.
- Miglio, A., Chiappini, C., Mosser, B., Davies, G. R., Freeman, K., Girardi, L., . . . Worley, C. C. (2017). PLATO as it is: A legacy mission for Galactic archaeology. Astronomische Nachrichten, 338(6), 644-661.
- Mojzsis, S. J., Harrison, T. M., & Pidgeon, R. T. (2001). Oxygen-isotope evidence from ancient zircons for liquid water at the Earth's surface 4,300 Myr ago. Nature, 409(6817), 178-181.
- Moyà-Solà, S., Köhler, M., Alba, D. M., Casanovas-Vilar, I., & Galindo, J. (2004). Pierolapithecus catalaunicus, a new Middle Miocene great ape from Spain. Science, 306(5700), 1339-1344.
- Nutman, A. P., Mojzsis, S. J., & Friend, C. R. (1997). Recognition of ≥ 850 Ma water-lain sediments in West Greenland and their significance for the early Archaean Earth. Geochimica et Cosmochimica Acta, 61(12), 2475-2484.
- Planck-Collaboration. (2020). Planck 2018 Results: VI. Cosmological Parameters. Astronomy & Astrophysics, 641, A6.
- Robin, A. C., Reylé, C., Fliri, J., Czekaj, M., Robert, C. P., & Martins, A. M. (2014). Constraining the thick disc formation scenario of the Milky Way. Astronomy & Astrophysics, 569, A13.
- Rogers, J., & Santosh, M. (2004). Continents and Supercontinents. Oxford University Press.
- Rothery, D. A., McBride, N., & Gilmour, I. (Eds.). (2011). An Introduction to the Solar System (2nd ed.). Cambridge University Press.
- Shields, G., & Veizer, J. (2002). Precambrian marine carbonate isotope database: Version 1.1. Geochemistry, Geophysics, Geosystems, 3(6), 1-12.
- Sleep, N. H., Zahnle, K. J., Kasting, J. F., & Morowitz, H. J. (1989). Annihilation of ecosystems by large asteroid impacts on the early Earth. Nature, 342(6246), 139-142.
- Strother, P. K., Battison, L., Brasier, M. D., & Wellman, C. H. (2011). Earth’s earliest non-marine eukaryotes. Nature, 473(7348), 505-509.
- Thorne, A., & Trendall, A. (2001). Geology of the Fortescue Group, Pilbara Craton, Western Australia. Geological Survey of Western Australia.
- Turnbull, M. J., Whitehouse, M. J., & Moorbath, S. (1996). New isotopic age determinations for the Torridonian, NW Scotland. Journal of the Geological Society, 153(6), 955-964.
- Veizer, J., & Mackenzie, F. T. (2003). Evolution of Sedimentary Rocks. In H. D. Holland, & K. K. Turekian (Eds.), Treatise on Geochemistry (Vol. 7, pp. 369-407). Elsevier.
- Walker, J. C. (1990). Precambrian evolution of the climate system. Global and Planetary Change, 2(3-4), 261-289.
- Wei, J.-J., & Melia, F. (2022). Exploring the Hubble tension and spatial curvature from the ages of old astrophysical objects. The Astrophysical Journal, 928(2), 165.
- Wellman, C. H., & Strother, P. K. (2015). The terrestrial biota prior to the origin of land plants (embryophytes): a review of the evidence. Palaeontology, 58(4), 601-627.
- White, T. D. (1980). Evolutionary implications of Pliocene hominid footprints. Science, 208(4440), 175-176.
- Wilde, S. A., Valley, J. W., Peck, W. H., & Graham, C. M. (2001). Evidence from detrital zircons for the existence of continental crust and oceans on the Earth 4.4 Gyr ago. Nature, 409(6817), 175-178.
- Wu, P. J., Qi, J. Z., & Zhang, X. (2023). Null test for cosmic curvature using Gaussian process. Chinese Physics C, 47(5), 055106.
- Yang, W., Giarè, W., Pan, S., Di Valentino, E., Melchiorri, A., & Silk, J. (2023). Revealing the effects of curvature on the cosmological models. Physical Review D, 107(6), 063509.
This site is hosted by Byethost
Copyright © Vierge Press
| < | > |